Carbon Dioxide, Carbonic acid gas, carbonic anhydride;
CO2; mol. wt. 44.01. Carbon 27.29%, oxygen 72.71%.Colorless, odorless, noncombustible gas and nonsupporter of combustion. At 20° and 50° atmos. condenses to a colorless, refractive liquid. On spontaneous evaporation of the liquid it solidifies to a white snow–like solid called "dry ice." d. gas 1.53 (air = 1); d–37 liquid 1.101; d–79 solid 1.56. m5.2 atmos. –56.6°. b. –78°. One vol. dissolves in 0.6 vol. water at O°, in 13 vols. water at 25°; one gram in 300 ml. water at O°, in 700 ml. water at 25°; less soluble in water at higher temps.; also less soluble in alcohol or in most other organic solvents.
Use: In form of gas as antiseptic in brewing; in refrigerating. mixtures; in carbonated beverages; preserving food products; manuf. salicylic acid; fire extinguishers. The solidified form "dry ice," is used for preserving food products during transportation and for other chilling purposes.
Med. Use: Respiratory stimulant. Toxicity: Dyspnea, vomiting, disorientation, elevation of systolic pressure usually appear when 5% concn. is administered for over a period of hr. High concns. cause asphyxiation.
Caution: Respiratory obstruction, pulmonary edema.
Grades available: U.S.P., technical.
thereby, Permanently Removing
Oxygen from the Atmosphere and Bio-system!
{ Can you say crispy critters ? }
Oxygen as O2 not O3, filters out most of the Sun's harmful Ultraviolet !!!
Do you remember the
Arizona Biosphere Disaster ? The whole planet will be next !!!
The following text and graphs explains this process down to the electron level.
" We do need leaders and citizens who can think like scientists and schools that can produce them. — George (Pinky) Nelson —There's a classic videotape made at a Harvard University graduation a few years ago that illustrates exactly what I mean. In the opening scene, young graduates and faculty members still in their caps and gowns answer this question: Why is it warmer in the summer and colder in the winter? Twenty-two out of 25 of them got the answer wrong.
Just as disturbing was how confidently and articulately the Harvard University grads, offered their incorrect explanations. They didn't recognize the contradiction between their typical explanation It's warmer in summer because the Earth is closer to the sun and their knowledge that when it's summer in Boston, it's winter in Sydney. ( The Earth is nearest to the sun during the northern winter. - Tommy C - )
THEY KNEW LOTS OF STUFF, BUT NOT HOW TO THINK ABOUT IT ".
GENERAL
In the existing literature, too little stress has been placed on the basic reasons for the variations sometimes noted in the chemical constituents of certain aqueous systems. Such changes may occur from moment to moment, hour to hour, day to day, or even month to month. These conditions often have been dismissed with the simple statement: "Results obtained cannot be reliably duplicated."
The writer deems a system to be "static" if it comes to a state of "reasonable equilibrium" within a period of say sixty to one hundred minutes, and most colloid systems do. A system, which does not reach reasonable equilibrium within a "reasonable period of time", should be considered "dynamic" but there can be no hard and fast rules governing these classifications.
The changes in measurable constituents noted in dynamic systems may or may not result in significant changes in colloid stability. Generally, but not necessarily, the trend is toward less stability. When appraising in detail the characteristics of a colloid system, it is also essential to investigate its dynamic qualities. Specific Conductance and pH are, in the writer's opinion, the simplest and most informative tests to elucidate the basic cause of dynamic manifestations. If time permits, phenolphthalein and methyl orange alkalinity are informative in differentiating bicarbonates, carbonates and hydroxides. And spectrographic analyses are helpful in approximating the type of electrolytes present. The effect on stability of these dynamic manifestations is best evaluated by Zeta Potential.
A rise in Specific Conductance will always occur when a slurry is formed by quickly adding say 50 grams of dry, colloidally sized powders to a liter of distilled water under moderately heavy agitation. Preferably, Specific Conductance and pH should be determined at geometric time intervals of 1, 2, 4, 8, 16, 32, 64, 128, 256, 512 and 1024 minutes after the addition of the colloid; and sometimes even longer intervals are indicated. The change in either Specific Conductance or pH may vary from slight–to–pronounced. The pH curve often rises to a peak, then lowers slightly and becomes asymptotic. There are basic reasons for this behavior, which should be well understood by those dealing with colloid stability. Actually, a continuing increase in Specific Conductance connotes a continuing increase in bulk–stress. We have previously shown that this may or may not result in significant stability changes, depending upon the type and concentration of the electrolytes involved.
We may categorize the above listed systems as:
System
Time Interval Generally Required
for a Significant Change
Oxides and Carbonates
minutes to hours
Asbestos
minutes to days
Blood
seconds to hours
Microorganisms
days to weeks
We will now deal at some length with the role played by atmospheric carbon dioxide in the ultimate conversion of hydroxides and carbonates to bicarbonates. While this conversion is often slow and attenuated, it is highly dynamic and thorough going. The natural laws governing these reactions have great relevance to colloid stability. If we are to work effectively with man–made colloid systems, which are dynamic in character, we must have a thorough understanding of the natural systems, which these laws were apparently designed to control. Some of these natural systems are discussed herein.
Calcium ( and to a lesser extent magnesium ) carbonate, geologically known as limestone, is the principal rock formation underlying a sizeable portion of the earth's land surface. It is also found in a finely ground state in many earth formations overlying bedrock.
Calcium carbonate is relatively insoluble in hot water, or
water at room temperature. Solubility amounts to only 15 ppm at 25°C, and 19 ppm at 75°C.
( Parts Per Million { ppm } = Milligrams per liter { mg / l } )
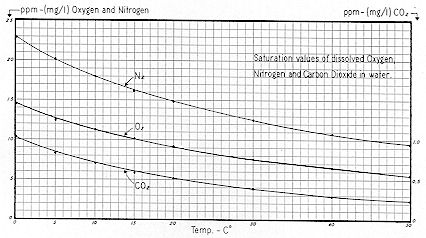
On the other hand, it is highly soluble in water containing an appreciable concentration of free carbon dioxide ( carbonic acid, H2CO3 ). But carbon dioxide is relatively insoluble in
water exposed to the atmosphere, being theoretically soluble to the extent of only 0.5 ppm at 20°C, and 1.0 ppm at O°C as shown on
Fig. 57.
* In a relative sense, solubility increases markedly with low temperature, being about 1,500 ppm at 9°C.
** Dissolved oxygen and nitrogen are also shown for comparison.
The low solubility of carbon dioxide is due to its low partial pressure in the atmosphere, which averages only 0.03% by volume as compared to 78.03% for nitrogen and 20.99% for oxygen.
The presence of carbon dioxide in the atmosphere is, of course, due to the oxidation of carbon. For example, this can be effected by either the rapid or gradual combustion of wood or other organics; or by normal animal metabolism ( respiration ) in which oxygen is utilized and carbon dioxide is given off as a by–product or end–product.
The maintenance of aquatic life necessitates that certain dissolved mineral salts be present in the water. These include calcium and magnesium bicarbonate and sulfate, and each degree of mineralization sustains characteristic types of flora and fauna. Thus, marine and fresh water aquatic life differs considerably.
While it has not been properly recognized, Nature mineralizes subsurface ( ground ) waters, river and lake waters, and ocean waters, in the following manner: Atmospherically distilled ( rain ) water falls on land. surfaces, percolates downward to ( and sometimes into ) bedrock, and then seeps laterally to form the normal stream flow of brooks and rivers. The concentration of micro–organisms in the soil comprising the upper few feet of the earth's crust ranges in the thousands to millions per cubic centimeter, depending principally upon the temperature, moisture, and food supply of the soil. These bacteria, fungi, yeasts, molds and actinomycetes often produce ( as an end–product of their metabolism ) sufficient carbon dioxide to raise the concentration of this gas a hundredfold in the interstitial soil space. Thus the concentration Of CO2 can be raised from 0.03% in normal atmosphere, to 3% in the upper six feet of soil.
This increase in partial pressure also raises the solubility of CO2 in water a hundredfold — from 1 to 100 ppm, or more.
Distilled ( rain ) water, with a saturation approximating only 0.5 to 1.0 ppm of dissolved CO2, can dissolve relatively little limestone. But distilled water with 50 to 100 PPM CO2 can dissolve significant quantities. Thus Nature employs microorganisms located on land surfaces to dissolve underlying rock formations — thereby furnishing the soluble mineral ingredients so necessary for the maintenance of aquatic life. This of course is but one of Nature's multitudinous cycles, many of which are symbiotic or quasi–symbiotic.
At this point, the reader begins to realize that absorption of atmospheric carbon dioxide in liquid–solids systems represents no haphazard phenomenon. Instead, it constitutes a fundamental law of Nature encompassing many facets, including the mineralization of all natural waters on the earth's surface. These systems are highly dynamic in that the longer a water containing a significant amount of dissolved carbon dioxide remains in contact with limestone, the greater will be its dissolved mineral content. Through this process and the process of continuous evaporation, the oceans gradually become more saline.
Getting back to the simple reactions involved in the solution of limestone:
2) CaCO3 + H2CO3 ====> Ca(HCO3)2
( relatively soluble ) ( relatively insoluble )
This recalls the old–fashioned marble slabs of soda fountains, and the significant wear always evident immediately beneath the "seltzer
water" spigot.
We can reverse this process and "soften" water, which is high in calcium bicarbonate, as follows:
3) CaCO3 + intense heat ===> 4CaO + CO2
Slaking of lime —
4) CaO + H2O ===> Ca(OH)2
Softening of water to remove calcium —
5) Ca(HCO3)2 + Ca(OH)2 ===> 2CaCO3 + 2H2O
( relatively soluble ) ( relatively insoluble precipitate )
( relatively insoluble ) ( highly soluble )
There is a well–defined theoretical and practical relationship between alkalinity, free carbon dioxide, and pH. This is shown on
Fig. 58
for simple unbuffered systems at room temperature. Thus an alkalinity of 10 ppm at a pH of 7.0 would represent a CO2 content of 2 ppm. However, at this same alkalinity and at a pH of 5.4, CO2 would approximate 80 ppm ( mg / l ). At an alkalinity of 200 ppm, a pH of 8.3 would represent a CO2 content of 2 ppm. However, a pH of 6.7 would also represent a C02 of 80 ppm.
* This is covered in several books by Selman A. Waxman. See: "Principles of Soil Microbiology" Williams & Wilkins 1927; and, "Soil Microbiology" Wiley 1952. See also "Soil Physics", Third Edition, p. 206, by L. D. Baver–John Wiley–1956. Baver notes CO2 values in interstitial air as high as 10 to 15%.
* Although calcium and magnesium represent the major cations discharged from the principal rivers of the world into the oceans, their concentrations in seawater are relatively low. This is due to their continuous utilization by marine flora and fauna for growth.
1) CO2 + H2O ====> H2CO3
This reaction proceeds very slowly as the minimum pH attainable by carbonic acid ( even at maximum concentration ) approximates only 3.8. However, significant solution of limestone does take place, and well–waters from say the 40 to 300 ft. strata normally pick up to 50 to 200 milligrams per liter of dissolved calcium and / or magnesium carbonate.
** Well–waters from the thousand–foot stratum in the Mid–western area of the United States often contain 1,000 to 2,000 ppm of dissolved mineral salts.
When water containing dissolved CaCO3 is aerated, the ( relatively insoluble ) calcium carbonate is gradually converted by atmospheric carbon dioxide to highly soluble calcium bicarbonate —
Formation of quicklime from limestone —
![]()
CaCO3 + H2C03 ===> Ca(HCO3)2
* For references to the monographs from which these curves were drawn, see sections dealing with carbon dioxide and alkalinity of "Standard Methods" ( of water analysis ) 1955 or 1965 editions—American Public Health Assn., 1790 Broadway, N. Y. City. Enlarged monographs Of CO2 Alkalinity and pH relationships are obtainable from the American Water Works Assn., 2 Park Ave., N. Y. City, @ $.50 per set of 4.
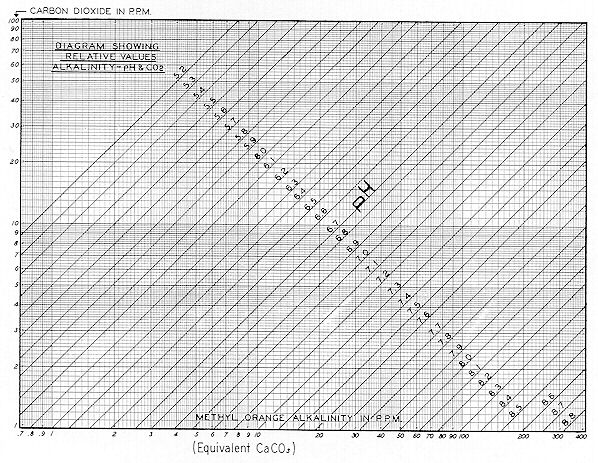
It will be shown later herein that when substantially any system containing soluble hydroxides and / or carbonates is exposed to the atmosphere, for even a short period, pH will decrease materially. This is because the ( 0.03% ) carbon dioxide of the atmosphere will convert them to the bicarbonate form. When so converted, free carbon dioxide will come into equilibrium ( for practical situations ) at a concentration approximating 1 to 3 ppm. Thus the ultimate equilibrium pH of a system is dependent upon its alkalinity. Actually, its pH will more often approximate the values shown on Fig. 58, which lie between 1 and 3 ppm of free ( dissolved ) CO2.
It will also be shown herein that relatively insoluble carbonates ( such as those of calcium and magnesium ) will also be slowly converted to the soluble bicarbonate form by atmospheric carbon dioxide.
These curves, and the ones immediately following, aid in rationalizing the basic cause of the dynamic changes, which are often found in Specific Conductance, pH, and colloid stability. When an aqueous colloid system ( dilute or concentrated ) is prepared from dry powders, and centrifuged its soluble dissociated ions will be clearly revealed through the Specific Conductance of the clear centrifuged liquor. The pH of such suspensions will usually range from 6 to 11, depending upon the concentration of alkalinity and whether the alkalinity is in the form of hydroxides, carbonates, or bicarbonates.
Hydroxides, carbonates and bicarbonates can be reasonably identified by also titrating a 100 ml sample as before with N / 50 H2SO4, using phenolphthalein as the indicator. In this instance, also using a 100 ml sample, phenolphthalein alkalinity in ppm = ml of H2SO4 used X 10. If T = total ( methyl orange ) alkalinity in ppm, and P = phenolphthalein alkalinity in ppm, then the concentration of hydroxides, carbonates and bicarbonates can be approximated, using the following table:
P = Alkalinity in presence of phenolphthalein or indicator of similar range.
Obviously, a system may contain both hydroxides and carbonates, carbonates and bicarbonates, or bicarbonates and free carbon dioxide, but a system cannot simultaneously contain hydroxides and bicarbonates, or carbonates and free carbon dioxide, or hydroxides and free carbon dioxide. For opaque or highly colored solutions, a pH meter may be substituted for the indicator solutions, in which case the color–change point of methyl orange should be considered pH 3.8 to 4.0; and phenolphthalein, 8.2 to 8.4. This simple concept, embodied in the Eighth Edition ( 1936 ) of "Standard Methods" for the examination of water ( American Public Health Assoc., N. Y. City ) has now been superseded by more elaborate concepts and techniques.
The higher pH values naturally reflect the presence of hydroxides and / or carbonates.
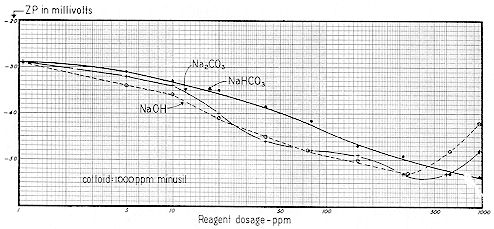
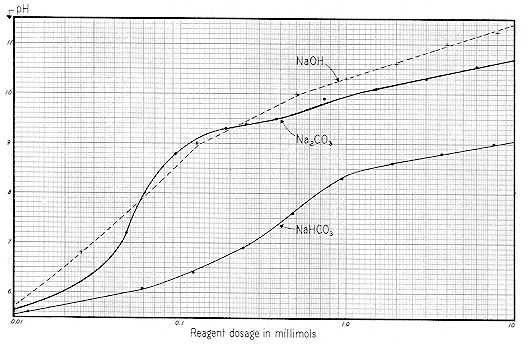
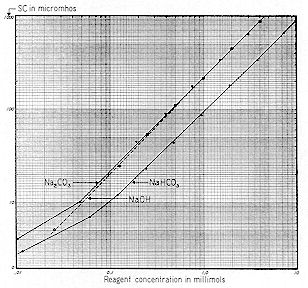
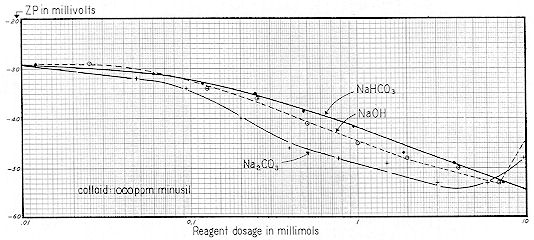
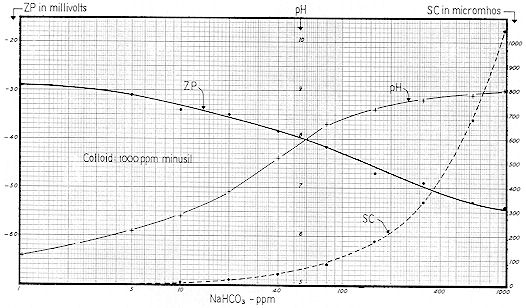
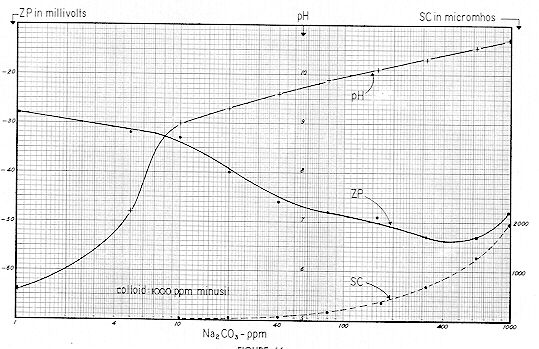
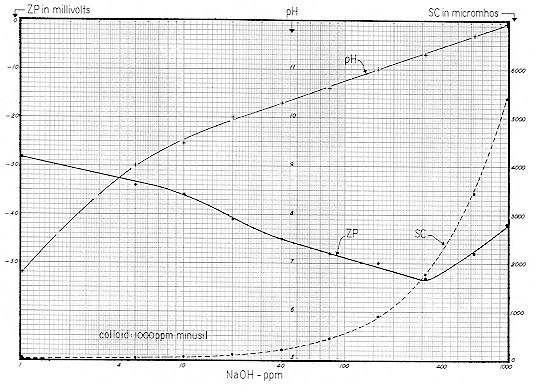
We now present a series of three curves showing the relationships between the concentration of sodium bicarbonate, carbonate and hydroxide and the resulting pH, Specific Conductance, and Zeta Potential. Sodium was chosen as the cation because of the difficulty of working with the relatively insoluble calcium. Since these are practical working curves, they are presented in three different manners for convenience:
The "ppm" nomenclature ( parts per million – mg / l ) of Figs. 59-61 is more convenient for the industrial chemist, whereas the "millimol" designation of Figs. 62-64 takes ionic concentration into proper account. Figs. 65-67 are useful in that they show the interrelationships of pH, Specific Conductance and Zeta Potential.
*In water analysis, alkalinity is always expressed in terms of equivalent CaCO3. Total alkalinity is determined by titrating a 100 ml sample with N / 50 H2SO4, employing methyl orange indicator. The ml of reagent used X 10 = ppm ( mg / l ) equivalent CaCO3
Result of titration.*
Value of radicle expressed in terms of calcium carbonate.
Hydroxide
Carbonate
Bicarbonate
P = 0
0
0
T
P < ½T
0
2 P
T – 2 P
P = ½ T
0
2 P
0
P = ½ T
2 P – T
2 ( T – P )
0
P = T
T
0
0
*T = Total alkalinity in presence of methyl orange or indicator of similar range.


To point up their differences and also to illustrate the use of these curves, several examples of static and dynamic systems follow.
Fig. 68 shows the pH and Specific Conductance of a 5% suspension of Minusil, plotted as a function of time after adding the colloid to distilled water. This would be considered a static system because after 100 minutes of continuous stirring, Specific Conductance amounted to only 27 micromhos and the curve had substantially leveled off. Basically, the gradual increase in SC represented a gradual increase in bulk–stress. From Fig. 19, it is evident that the effects of bulk stress are due to type, as well as concentration of electrolyte. The SC curve on Fig. 68 gives evidence of low bulk–stress.
In connection with Purecal, on p. 42 we presented a simple formula for determining the mg of "natural bulk–stress" ( in terms of equivalent NaCl ) per gram of suspended solids. This formula was:
NBS = SC ÷ 2,000 X % liquid in system ( by weight ) ÷ % suspended solids in system ( by weight )
We now apply this formula to the 5% Minusil suspension of Fig. 68:
NBS = 27 ÷ 2,000 X 95 ÷ 5 = 0.26 mg ÷ g equiv. NaCl.
We next apply the formula to the 64% Minusil suspension shown on Fig. 23.
NBS = 840 ÷ 2,000 X 36 ÷ 64 = 0.24 mg ÷ g equiv. NaCl.
So it would seem that "natural bulk–stress" is a very measurable quantity and that results can be "reasonably" duplicated at either 5% or 64% suspended solids concentration. However, it is evident that one must make these measurements after the system has come to "reasonable" equilibrium. In this instance, the contact time must be in the neighborhood of 60 to 100 minutes.
On p. 23, we noted that the SC of a solution could be expressed in terms of equivalent Mg / l of NaCl, by dividing the SC in micromhos by 2. The ( NaCl ) equivalent mg / l of the 5% Minusil system shown on Fig. 68 would therefore be 27 ÷ 2 = 13.5
Reference to Fig. 59 shows that a pH of 6.6 would result from the addition of 13 ppm of sodium bicarbonate alkalinity. These curves indicate that bicarbonates ( and perhaps some carbonates ) were involved; not hydroxides.
From Fig. 68, Specific Conductance at the time of initial reading ( 12 sec. ) was 11 micromhos. The dissociated ions could have represented either a highly soluble bicarbonate, or a simple electrolyte. The gradual rise in pH to 7.2 after 24 minutes suggests the solubilizing of a very small amount of say calcium or magnesium carbonate, which probably was present in the Minusil as a trace impurity. The lowering of pH from 7.2 to 6.6 after 200 minutes of contact suggests the conversion ( by atmospheric carbon dioxide ) of calcium ( or magnesium ) carbonate to the bicarbonate form. Actually, most hydroxides and / or carbonates will eventually be converted to bicarbonates, and the equilibrium then attained will represent approximately 1 to 3 ppm of "dissolved" carbon dioxide ( as CO2 )
The curves of Fig. 58 assume that the system contains only bicarbonate alkalinity, with free carbon dioxide varying from 1 to 100 ppm. These curves do not provide for the condition of bicarbonates plus carbonates.

Table No. 8 was prepared to check the practical NaHCO3 curve* of Fig. 59 against the theoretical curves of Fig. 58. Since the Molecular Weight of calcium carbonate is 100, and sodium bicarbonate 84 ( and taking into account their reaction with HCl ), 100 ppm of calcium carbonate is equivalent in alkalinity to ( 84 X 2 ) 168 ppm NaHCO3. The values of Column 2, therefore, are simply those of Column 1 multiplied by 1.68.
| Alkalinity Equivalent CaCO3 – ppm | Actual Dosage NaHCO3 | Measured pH – from Fig. 59 |
Theoretical pH – from Fig. 58 @ 1 ppm CO2 | Measured pH divided by Theoretical pH |
|---|---|---|---|---|
| ( 1 ) | ( 2 ) | ( 3 ) | ( 4 ) | ( 5 ) |
| 400 | 670 | 8.9 | 8.9 | 1.00 |
| 200 | 340 | 8.8 | 8.6 | 1.02 |
| 100 | 170 | 8.6 | 8.3 | 1.04 |
| 50 | 84 | 8.2 | 8.0 | 1.02 |
| 25 | 42 | 7.6 | 7.7 | 0.98 |
| 12.5 | 21 | 7.0 | 7.4 | 0.94 |
| 6.2 | 10 | 6.5 | 7.1 | 0.91 |
Table No. 8 reveals that theoretical and actual pH values correlate well from about 12.5 to 400 ppm equiv. CaCO3. Values below: 12.5 become erratic due to lack of buffer salts. Moreover, the pH of distilled water is variable, depending upon its contact with the atmosphere during and after distillation. Broadly speaking, it will be found that the curves of Fig. 58 conform to practical situations and they help rationalize the pH and alkalinity of many colloid systems. Three Figures ( #69, #70, and #71 ) illustrate the highly dynamic changes which occur when aqueous systems containing sodium hydroxide, calcium carbonate, and free carbon dioxide respectively, are exposed to atmosphere containing normal ( 0.03% ) carbon dioxide. Contact of solutions or colloidal suspensions with atmospheric CO2 is greatly facilitated by employing a forced draft aerator instead of a mechanical stirrer. Therefore, a one liter sample was placed in a 1500 ml beaker, and a 1" dia. carborundum diffuser stone was submerged to mid–depth. The air diffuser was supplied at approximately 0.5 cu. ft. "free air" per minute.

For the first experiment ( Fig. 69 ), 200 mg of NAOH was added to a liter of distilled water. Aeration was maintained for a period of 160 minutes, with results as shown. Initial pH was 11.1 which checks with the value shown on Fig. 59 for 200 ppm of NAOH. Initial SC was 1,020, which checks reasonably with the comparable value shown on Fig. 60.
Again referring to Fig. 69, it is evident that since:
the 200 ppm of NAOH was equivalent to:
This value, in turn, was equivalent to:
Note from Fig. 69 that pH decreased from 11.1 to 8.2 in 80 minutes, and that Specific Conductance decreased in this same interval from an initial value of 1020 to 400 micromhos.
From Fig. 58, an equivalent alkalinity of 250 ppm and pH of 8.2 represents a free CO2 value of 3 ppm. Thus, practical and theoretical considerations check reasonably well. Note from Fig. 60 that 200 ppm of NAOH gives a SC value of about 1,O20, whereas 420 ppm NaHCO3 gives a SC of 440 micromhos. The reduction of Specific Conductance upon conversion of hydroxide to bicarbonate alkalinity is therefore rationalized. Fig. 70 shows the results of aerating a suspension of 50 ppm of "reagent grade" calcium carbonate. After one minute the pH was 6.4 — rising to 7.6 in six minutes — then falling sharply to 7.3 — and again gradually rising to 7.4. Specific Conductance was initially 8 micromhos. It may have been that over a period of years, the ( bottled ) reagent had gradually picked up atmospheric carbon dioxide, thereby changing a portion of it to the bicarbonate form. Or it could be that no bicarbonate was present — but a small amount of CaCO3 dissolved immediately.
The rate of increase in SC from seven minutes to two hours was uniformly exponential, and there–after leveled off. If we translate these results into terms of practical colloid stability, we find that "bulk–stress" was being increased by the conversion of the relatively insoluble carbonate — to the highly soluble bicarbonate form.
*All pH readings in this book were made with a Beckman Model M or Expandomatic pH meter, using standard Beckman electrodes.
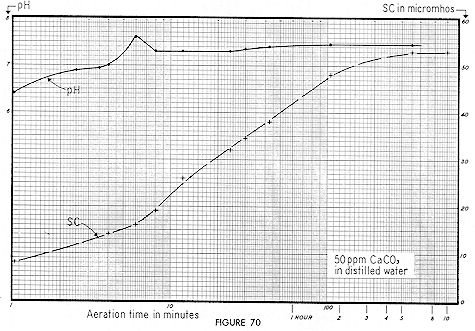
Carbonates and oxides ( particularly of calcium and magnesium ) are a frequent trace contaminant, and we believe that the curves of Fig. 70 are germane to this phase of many colloid systems. Note that although Specific Conductance rose from 8 to 50 micromhos in 125 minutes of aeration, this same rise would have been effected with mechanical stirring, but it would have required more time. In fact, this rise would have occurred with no stirring but over a still longer time interval. The gradual conversion of many hydroxides and carbonates ( both soluble and relatively insoluble ) to the soluble bicarbonate form can be prevented only by excluding air — and thus excluding carbon dioxide.
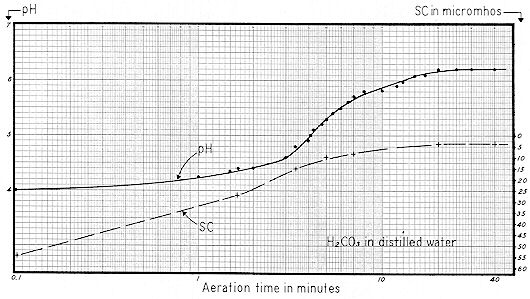
Fig. 71 shows the result of aerating water containing an excess of carbon dioxide. A one quart seltzer bottle was filled to normal level with distilled water, then "charged" with the usual cylinder of compressed carbon dioxide. This "charged water" was then discharged to a 1500 ml Griffin low–form beaker, and aeration was effected with a 1" diameter carborundum diffuser stone as before.
Note that initial pH was 4.0 as contrasted with an absolute minimum of about 3.8. Also note that this dissociated H2CO3 produced an initial Specific Conductance of 55 micromhos. Both curves leveled off after 20 minutes of aeration, with a pH of 6.2 and SC of 4 micromhos.
If a first quality distilled water is freshly boiled and cooled without exposure to air, SC will range from about 0.1 to 1 micromhos. After being exposed to atmosphere, sufficient CO2 is normally absorbed to raise SC to the 2 to 4 micromhos level.
The carbon dioxide content of many well–waters ranges from say 10 to 60 ppm. Such waters will generally have pH values predictable from Fig. 58. That is to say, a well–water with an alkalinity of 100 ppm and a pH of 6.6 will have a CO2 of approximately 50 ppm. When a water of this type is vigorously aerated or boiled, its pH will immediately rise to the range of 7.8 to 8.3 reflecting a reduction of carbon dioxide to the residual of 1 to 3 ppm previously referred to. However, if allowed to stand for a matter of weeks with no agitation, the excess carbon dioxide will be given off as completely as with agitation. This change in pH which may also result in a change in colloid stability is obviously of interest to many industries who prepare colloid systems with well–water.
Finally, it should be noted that earth reservoirs of depth greater than about 30 feet undergo distinct stratification. Water from the top third ( zone of circulation ) will normally contain 1 to 3 PPM Of CO2, whereas water from the bottom third ( zone of stagnation ) may contain as high as say 30 to 40 ppm CO2 because of decomposing organic matter. Thus, carbon dioxide can be found in both well–waters and surface–waters.
In presenting
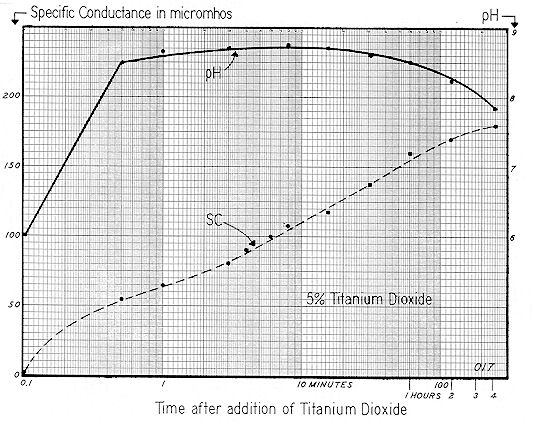
Fig. 72, we show the sequential change in Specific Conductance and pH when .50 grams of commercial dry powdered titanium dioxide is added to a liter of distilled water. Stirring was mechanical — at about 300 rpm.*
*The stirrer employed was Fisher #14-497VA.
Specific Conductance continued to rise exponentially for a period of about 100 minutes; then the slope tapered sharply. However, after four hours, the curve had not completely leveled off. Obviously, this system is more dynamic than the 5% Minusil shown on Fig. 68.
Hydrogen ion concentration changed rapidly during the initial period of mixing, pH rising from 6.0 to 8.5 after one–half minute of stirring. A decided decrease in pH ( from 8.7 to 7.8 ) was noted during the time interval from 15 to 250 minutes. While the semi–log scale for Specific Conductance on Fig. 72 is convenient to plot, a curve of this type cannot convey the time sequences as clearly as an arithmetic plot.
An arithmetic plot of this same Specific Conductance data is shown on Fig. 73. With this type of curve it is obvious that the reaction has gone through to "substantial completion" in about l00 to 200 minutes.
( equiv. NaCl ) per gram of suspended solids. This, of course, is about seven times the comparable value for Minusil ( say 0.25 mg / g ).
From these data we conclude that due to its dynamic qualities, a slurry of TiO2 should be kept under constant agitation for at least two hours.
SC curves such as those of Fig. 72 and Fig. 73 indicate that ions are being released by the colloid over a considerable period of time and that they dissociate in the liquid phase. But they do not indicate whether the stability of the system is thereby increased, decreased, or remains unchanged. The principal advantage of initially determining SC and pH is that these tests materially broaden our knowledge of how the slurried system behaves. Moreover, they can be performed quickly.
From the curves of Fig. 72 and Fig. 73, it is evident that if the ZP is determined on samples collected at time intervals of say 1, 10, and 150 minutes, reasonable knowledge of the progressive changes in the stability of the system can be gained. Fig. 74 shows the SC and ZP of a 5% suspension of the same titanium dioxide employed for Fig. 72 and Fig. 73. Note that SC values agree reasonably well:
| Time of Mixing | 1 min. | 10 min. | 150 min. |
|---|---|---|---|
| SC of Initial Sample ( Fig. 72 ) | 65 | 110 | 177 |
| SC of Second Sample ( Fig. 74 ) | 60 | 100 | 130 |
The somewhat higher values for the initial sample obtain because this slurry was continuously stirred by a mechanical mixer and also continuously recirculated and sheared by a Sigmamotor T–6S peristaltic pump. The second sample was agitated by a mechanical mixer only.
Fig. 74 shows that the initial ZP after 1 minute of mixing was –39 mv, decreasing to –38 mv after a 10 minute period. After 2 ½ hours, ZP leveled off at –29 mv. Thus the dynamics of this system created a net Zeta Potential change of 10 mv; a sizeable figure if stability is critical.
This titanium dioxide became less stable upon the gradual build–up of its "natural bulk–stress." But one cannot generalize, because the trend will depend largely upon the type and concentration of the electrolytes, which dissociate and release their ions to the bulk of the suspending liquid. It seems probable that the initial value of –39 mv reflects the presence of a low concentration of say a 1:1 electrolyte, but that the gradual build–up in dissociated ions was due to a 2:2 electrolyte — such as CaCO3.
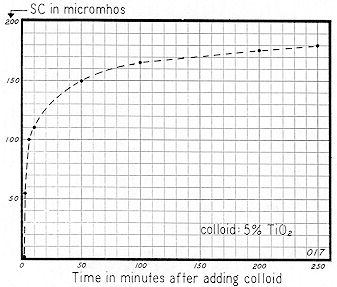
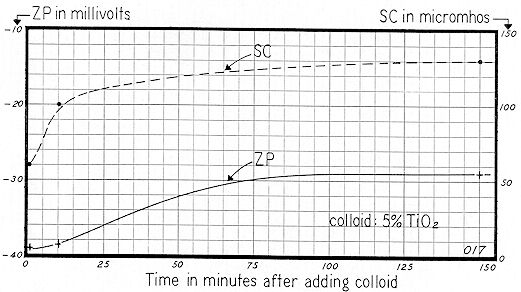
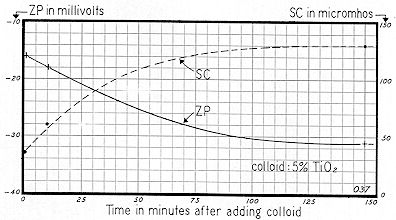
Fig. 75 shows another type of TiO2 from the same producer. While the SC curves for the two types were somewhat similar, the ZP curves are quite dissimilar. After one minute, Zeta Potential was –16 mv, increasing to –18 mv in 10 minutes and –31 mv in 150 minutes. This, then, represents a net change in ZP of 15 mv, as compared with 10 mv for the TiO2 of Fig. 74.
Figures 74 and 75 emphasize two important points. First, if one had made a determination of the ZP of both titanium dioxide samples within 10 minutes after slurrying, his widely divergent results would have suggested widely divergent stabilities. But this conclusion would have been highly erroneous, since after the bulk–stress of each system had risen to its approximate maximum ( a time interval of about 2.5 hours ), the ZP of both systems was approximately the same.
The second point stressed in these curves is that upon standing, a change of Zeta Potential of 10 to 15 mv can be very significant. If colloid systems are poised near the threshold of agglomeration or dispersion, this variation can change a stable system to an unstable one; and vice versa.
Again emphasizing that the dynamics of systems must be taken into account, we stress that there is nothing unusual or abnormal in this behavior. It is rationalized to the highest degree by a proper concept of bulk–stress and the part which the type of electrolyte plays in overall colloid stability.
A conclusion that: "Results obtained cannot be reliably duplicated" arises, we believe, from failure to take these facets into proper account. Our convictions are strong that substantially all factors affecting colloid stability can now be reasonably rationalized; and with meticulous technique, results can be "reasonably" repeated.
In a recent paper entitled "Relation Between the Zeta Potential of Bentonite and the Strength of Unfired Pellets," a table was listed showing the SC, ZP and pH of ten Bentonites. We reproduce this as Table No. 9 by kind permission of Rodney Stone and the AIME.*
*Presented before the Society of Mining Engineers of AIME, Fall Meeting, Tampa, Florida, Oct. 13–15, 1966, by Rodney L. Stone, Engineer, Ore Dressing — Homer Research Labs., Bethlehem Steel Corp., Bethlehem, Pa.
These data are shown on Fig. 76 in which both pH and ZP are plotted against Specific Conductance. For each curve, a high degree of correlation is shown for eight of the ten plotted points. This condition seems to reflect the marked influence of natural bulk–stress. Without a concept of bulk–stress, at first glance one might be inclined to believe that these ten clays per se varied significantly. But a knowledge of bulk–stress would suggest that the variations noted were principally due to dissociation of extraneous ions that were inherent to the clays. This point could readily be settled by dialyzing the 1,000 ppm suspensions employed then suspending each clay in either distilled water or, say, a 250 ppm solution of NaCl. It seems probable that under these conditions, ZP values would show little variation in eight of the ten Bentonites.
| Bentonite | Zeta Potential millivolts** | pH** | Specific Conductance micromhos** |
|---|---|---|---|
| Wyoming A | 34 | 8.9 | 36 |
| Wyoming B | 32 | 8.6 | 31 |
| Wyoming C | 33 | 8.8 | 34 |
| Ohio | 30 | 8.4 | 34 |
| Yugoslavia | 28 | 9.5 | 65 |
| Greece | 25 | 9.3 | 42 |
| Mexico | 26 | 8.7 | 21 |
| Missouri | 19 | 6.6 | 4 |
| Brazil | 17 | 7.1 | 9 |
| Pennsylvania | 17 | 6.4 | 2 |
Previously we pointed out (p. 16) that most of the commercially available clays are "pre–treated." That is to say, they are often treated at the stripping site with an anionic surfactant such as sodium tetrapyrophosphate to facilitate their ready transport by pipeline to the processing plant. There, they are coagulated with ( say ) aluminum sulfate to remove iron and facilitate vacuum filtration — then dispersed again. It would seem that the first seven of the listed Bentonites had been so treated, for the natural bulk stress of the first sample ( Wyoming A ) would be
34 ÷ 2,000 X 99.9 ÷ 0.1 = 17 mg ( equiv. NaCl ) per gram of suspended solids.
This value is relatively high compared with the natural bulk–stress of most of the colloids with which we have dealt thus far. Therefore it seems possible that these clays reflect their degree of pre–treatment to a greater extent than they reflect their source, composition, or innate surface charge characteristics.


" Control of Colloid Stability through Zeta Potential "
— Introduction
Zeta Potential represents a basic law of Nature, and it plays a vital role in all forms of plant and animal life.
CHAPTER 22
The application of basic concepts of Zeta Potential to cardiovascular disease
Thomas M. Riddick's personal experiences with a cardiovascular condition.
( Sometimes you should read the last chapter of a book first. )
Understanding Colloidal Suspensions
Dr. T.C. McDaniel — "Using Zeta Potential as a Healing Tool"
A summary compiled and submitted by
Frank Hartman.
" The Arizona Biosphere Disaster "
An Important Lesson For and About Planet Earth.
The reason that the Original Biosphere project failed was because the designers didn't understand the Electro–Chemical properties of concrete. They failed to account for the "Curing Process".The Oxygen Level Inside became too low to support life. WHY ?
Columbia University's Biosphere 2 Front Page
If you assimilated the information above, you should now have a complete understanding of how it happened there and the correlation with the current conditions on earth. Remember, originally there was No Molecular Oxygen in our planet's atmosphere.
What becomes concrete starts out as calcium bicarbonate. It is then "roasted" in a kiln at about 1,100° F. This releases one of the CO2 molecules and creates calcium carbonate. The calcium carbonate "cinders" are ground to a power and then aluminum and sometimes other materials are added to the cement to produce a material that will form a precise colloidal suspension when mixed with water and aggregate to form concrete.
If the Zeta Potential of the mix is correct, the concrete will stay fluid in the truck and then harden at a precise time after it is removed from the truck.
Concrete goes through a slow curing process becoming harder and stronger with time. Carbon Dioxide is absorbed from the surroundings and a chemical process occurs turning the calcium carbonate into calcium bicarbonate. The absorption rate decreases with time but continues for 50 to 100 years.
The concrete in the Biosphere absorbed the carbon dioxide from the air inside. There wasn't enough carbon dioxide for the plants to grow properly, so they couldn't turn carbon dioxide into molecular oxygen. There wasn't enough carbon dioxide for them to work with.
Meanwhile, the aerobic bacteria were busy doing their work turning organic material into inorganic ions for the plants to feed on. These bacteria "breath" molecular oxygen much in the same way we do and "breath out" carbon dioxide just as we do ( and plants do also for that matter, day and night ).
So the plants are breathing oxygen and chlorophyll doesn't have the material it needs to do its work, the bacteria are breathing oxygen, and so are the people. Soon the oxygen levels became too low to support life. If the chemistry of concrete would have been understood, they would have realized that they needed to add carbon dioxide to the air inside to keep everything in proper balance.
( I bet you thought I would say add more oxygen ! Why would doing this throw everything out of balance ? )
Can you explain now, why the oxygen level in our Earth's atmosphere is decreasing ?
What effects will lower
Oxygen levels have on our Bio–life cycle ?
Think and live happy.

Located about 35 miles northeast of Tucson off Hwy 77.
PO Box 689, Oracle, AZ 85623.
Phone: (520) 896–6400.
Daily tours 8am–5pm.
Beginning in September 1991, this unusual glass–enclosed, airtight environment was the scene of a two year experiment in which eight people attempted to live on their own. Basically a giant greenhouse, Biosphere 2 is now mostly a tourist destination.
The Tortoise Shell Hydroponic Reference Center
Using Hydroponics to Understand the Earth's Life Processes
on the Atomic Level
The Tortoise Shell Web Site Link List
Tommy's History of Western Technology
Color Pictures of Mineral Deficiencies in Plants